

First Pass Yield – Part 1
This article is the second in a 4-part series:
Part 1: Continuous Improvement for Cable/Harness assembly
Part 2: Divide and Conquer your BAD Cables/Harnesses
Part 3: Getting Quality Right the First Time
Part 4: Measuring Success: Why Put a Dollar figure on Quality Improvement?
Continuous Improvement for Cable/Harness Assembly
We all need to look at how to improve quality while improving our bottom line. Spending money on quality and productivity improvements must be well justified.
In this 4-part series we will move from:

- Metrics that help define the size of your quality problems, to:
- Tracking the kind of quality problems encountered and their true costs, leading to:
- Identifying countermeasures to eliminate quality problems and financial justification for improvement actions, ending in:
- Implementing countermeasures and verifying the improvements.
What is your First Pass Yield for Cable/Harness Assemblies?
When you need to improve quality in your cables and harnesses we recommend focusing on “First Pass Yield” as a good place to start. First Pass Yield (FPY) is a simple metric that can identify problem areas in a process. If you use Lean and Six Sigma you may already track your process performance, but you might find that another perspective reinforces your continuous improvement actions.
First Pass Yield is defined as the number of defective assemblies (discovered in testing/inspection etc.) divided by the total number of assemblies produced. If an assembly might fall-out at several stages, such as testing over-molded cables both before and after molding, you need to combine the yield of each production stage by multiplying them together to get the FPY of the completed product.
To get FPY data for defects that show up on Cirris testers, see Retrieving FPY from your Cirris Tester.
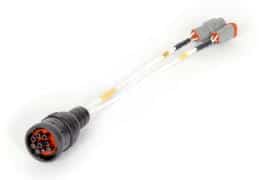
You could have one FPY number for your entire facility, but if you build assemblies with very different levels of complexity (simple cables vs. complex harnesses for example) then you might want to group different assemblies into families for the purpose of tracking FPY. For example:
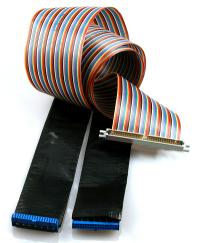
|

|
| Ribbon cable assemblies | Harness assemblies |

What metrics do you use?
You may already use metrics, such as Six Sigma, which defines defects in parts per 3.4 million opportunities. Possible definitions of an ‘opportunity’ include:
- One completed assembly – is one ‘opportunity’ (if you use this as a measure, you likely have a fairly high number of defects per 3.4 million in your first pass).
- Each connector – is one opportunity.
- Each wire end – is one opportunity.
- Each wire end could have an open, short, miswire, so some multiplier is used.
- Something else? Let us know!

How do you define opportunity?
One of the challenges of representing results using Six Sigma is that you must be consistent with your definition of an “opportunity” (to show a lower defect rate per 3.4 million parts, one might choose definitions that create more opportunities per assembly). Keep in mind that our goal is to find ways to make improvements that lead to cost savings, not simply make the numbers look good.
For stage 2 of our ‘Continuous Improvement’ series you will need to know your:
- FPY for each assembly family you defined
- Number of assemblies per month for each family, OR
- Definition of an opportunity
- Defects per 3.4 million opportunities
- Number of opportunities per month
To get a head start on the next part in this series, look at how you classify the kinds of defects found in your first-pass-testing. And, if you’re willing, please share your FPY data with us. We won’t present any company names, only summary data of what others are using as FPY metrics.
Next: Tracking the kind of quality problems encountered and their true costs. See the Divide and Conquer your BAD Cables/Harnesses.